File:Quantification of longevity, cell speed, and trajectories in time-lapse movies of nuclear red-labeled chicken embryos.jpg
Original file (1,076 × 1,122 pixels, file size: 245 KB, MIME type: image/jpeg)
Captions
Captions
Summary
[edit]
| Description |
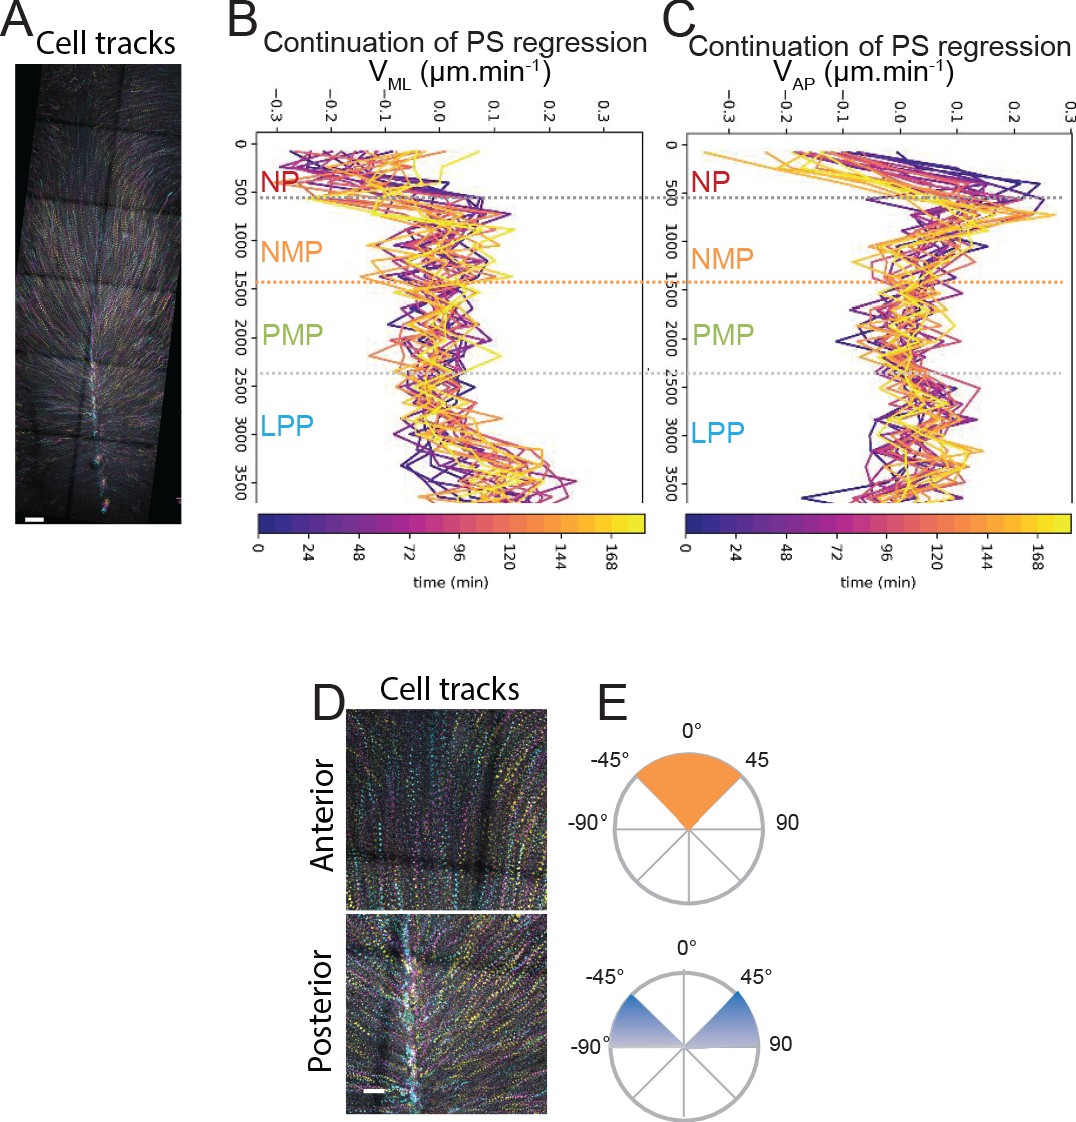
Figure 6—figure supplement 1. Quantification of longevity, cell speed, and trajectories in time-lapse movies of nuclear red-labeled chicken embryos. |
| Date | |
| Source |
https://elifesciences.org/articles/64819#fig6s1 https://doi.org/10.7554/eLife.64819 Dynamics of primitive streak regression controls the fate of neuromesodermal progenitors in the chicken embryo eLife 10:e64819. |
| Author | Charlene Guillot Yannis Djeffal Arthur Michaut Brian Rabe Olivier Pourquié |

|
This file, which was originally posted to an external website, has not yet been reviewed by an administrator or reviewer to confirm that the above license is valid. See Category:License review needed for further instructions.
|
Copyright
© 2021, Guillot et al.
This article is distributed under the terms of the Creative Commons Attribution License, which permits unrestricted use and redistribution provided that the original author and source are credited.
Licensing
[edit]
- You are free:
- to share – to copy, distribute and transmit the work
- to remix – to adapt the work
- Under the following conditions:
- attribution – You must give appropriate credit, provide a link to the license, and indicate if changes were made. You may do so in any reasonable manner, but not in any way that suggests the licensor endorses you or your use.
File history
Click on a date/time to view the file as it appeared at that time.
| Date/Time | Thumbnail | Dimensions | User | Comment | |
|---|---|---|---|---|---|
| current | 20:07, 2 May 2024 | | 1,076 × 1,122 (245 KB) | Rasbak (talk | contribs) | {{Information |description= Figure 6—figure supplement 1. Quantification of longevity, cell speed, and trajectories in time-lapse movies of nuclear red-labeled chicken embryos.<br> (A) Maximum time color-coded projection showing the tracks of cells labeled with nuclear red in a stage 5HH chicken embryo analyzed at the 6-somite stage. Early to later timepoints are indicated by cyan to magenta to yellow color code. (B, C) Mean medial to lateral speed (VML, C) and anterior to posterior speed (V... |
You cannot overwrite this file.
File usage on Commons
There are no pages that use this file.